Chart of the day
- February 17, 2025
- 3min read
DXY Dollar Index: Bearish Momentum Strengthens as Wave (3) Awaits Breakdown
DXY Outlook: Bearish Bias as Key Support Levels Face Pressure
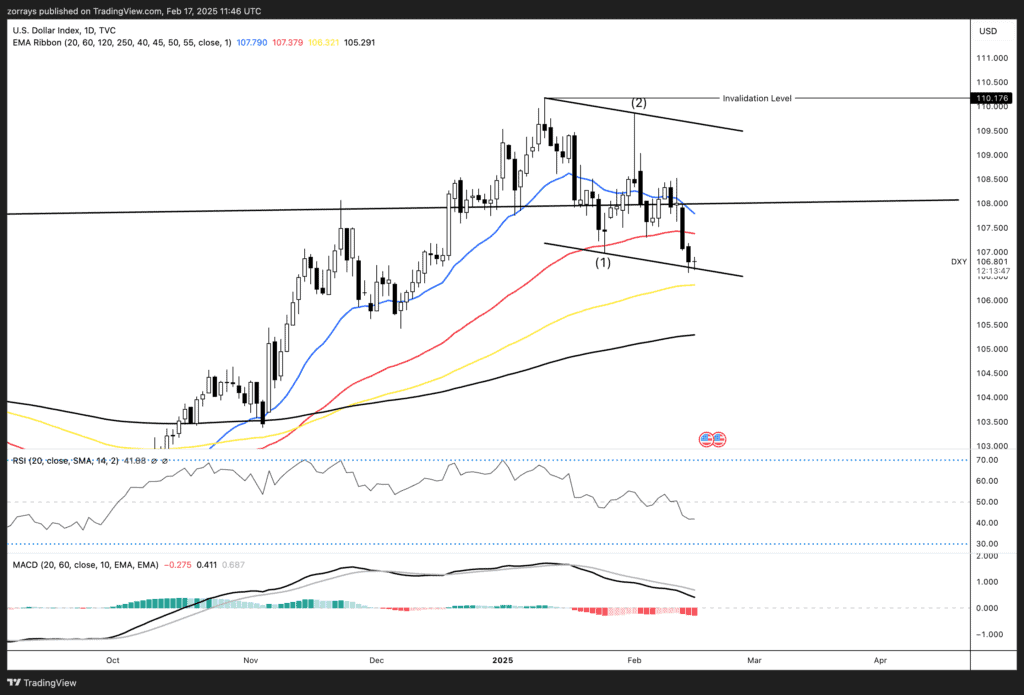
The US Dollar Index (DXY) continues to weaken, with price action now testing the lower bounds of its descending channel. After a 3% decline from its early January highs, the dollar’s momentum appears to be fading, and the technical picture suggests further downside movement could be on the horizon.
A key factor in this outlook is the potential breakdown from the current channel, which could confirm the start of an Elliott Wave Theory Wave (3) to the downside. This bearish setup is reinforced by a combination of technical indicators that signal further weakness, although some long-term support levels remain in play.
Bearish Signals Align for Further Downside Move

Several technical indicators confirm the growing bearish outlook:
1. RSI Shows Bearish Travelling Pattern
The Relative Strength Index (RSI) is trending lower, currently sitting at 41.85, well below the key 50 neutral level. A declining RSI without significant rebounds suggests that selling pressure remains dominant. Additionally, RSI still has more room to the downside, meaning sellers have not yet exhausted momentum.
2. MACD Confirms Bearish Momentum
The Moving Average Convergence Divergence (MACD) indicator also supports the bearish thesis. The MACD line has crossed below the signal line, a strong sell signal, and the histogram is expanding in negative territory, reflecting growing downside momentum. Given that MACD still has room to fall, this adds weight to the argument that the dollar’s decline is far from over.
Key Moving Averages and Structural Support Levels
Although the technical indicators suggest a bearish continuation, the DXY still faces a few obstacles before fully breaking down.
1. Below the 20-day and 60-day Moving Averages
The price is currently well below the 20-day and 60-day moving averages, which represent the last monthly and quarterly trading averages. This means that short-term momentum has decisively shifted bearish, as buyers have struggled to regain control in recent weeks.
2. 120-day and 250-day Moving Averages as Key Barriers
However, the 120-day and 250-day moving averages remain in play and could provide potential support. These moving averages are crucial because they represent:
- 120-day MA → Approximately six months of trading data.
- 250-day MA → Roughly one year of trading history.
These levels are significant as they track broader institutional trends, reflecting the longer-term market sentiment. If the DXY fails to break below these key averages, it could delay the bearish outlook. But if sellers push through, we could see a much deeper decline.
Wave (3) Setup and Potential Price Target
Given the overall technical picture, the most probable scenario is a continuation into Wave (3) to the downside. A breakdown from the current structure could see DXY heading lower, possibly towards the 104–105 region in the coming weeks.
This bearish wave aligns with:
- The failure to hold above key support levels.
- Momentum indicators (RSI and MACD) still having room to decline.
- Ongoing economic uncertainties and shifts in US trade policies that could further weaken the dollar.
Final Thoughts: Downside Bias but Watch Key Moving Averages
While the US Dollar Index (DXY) appears primed for a breakdown into Wave (3), traders should watch how price reacts to the 120-day and 250-day moving averages. A clean break below these longer-term averages could accelerate the bearish move, but if these levels hold, a temporary relief bounce could occur.
For now, the bearish case remains dominant, and as long as the dollar remains below the 20-day and 60-day moving averages, the downside pressure will likely persist.


