Written by:

Chart of the day
- March 17, 2025
- 2min read
SPX Mid-March Reversal in Play? 4H and 1D Double Bottom Spotted
After a 10% drop from ATH, the S&P 500 is looking oversold on the daily and 4H charts, which could mean selling pressure is easing. We’re also seeing a double bottom forming, backed by a regular bullish RSI divergence—both solid signs of a potential reversal and aligning from a multi-timeframe perspective.
Technical Analysis of SPX Index
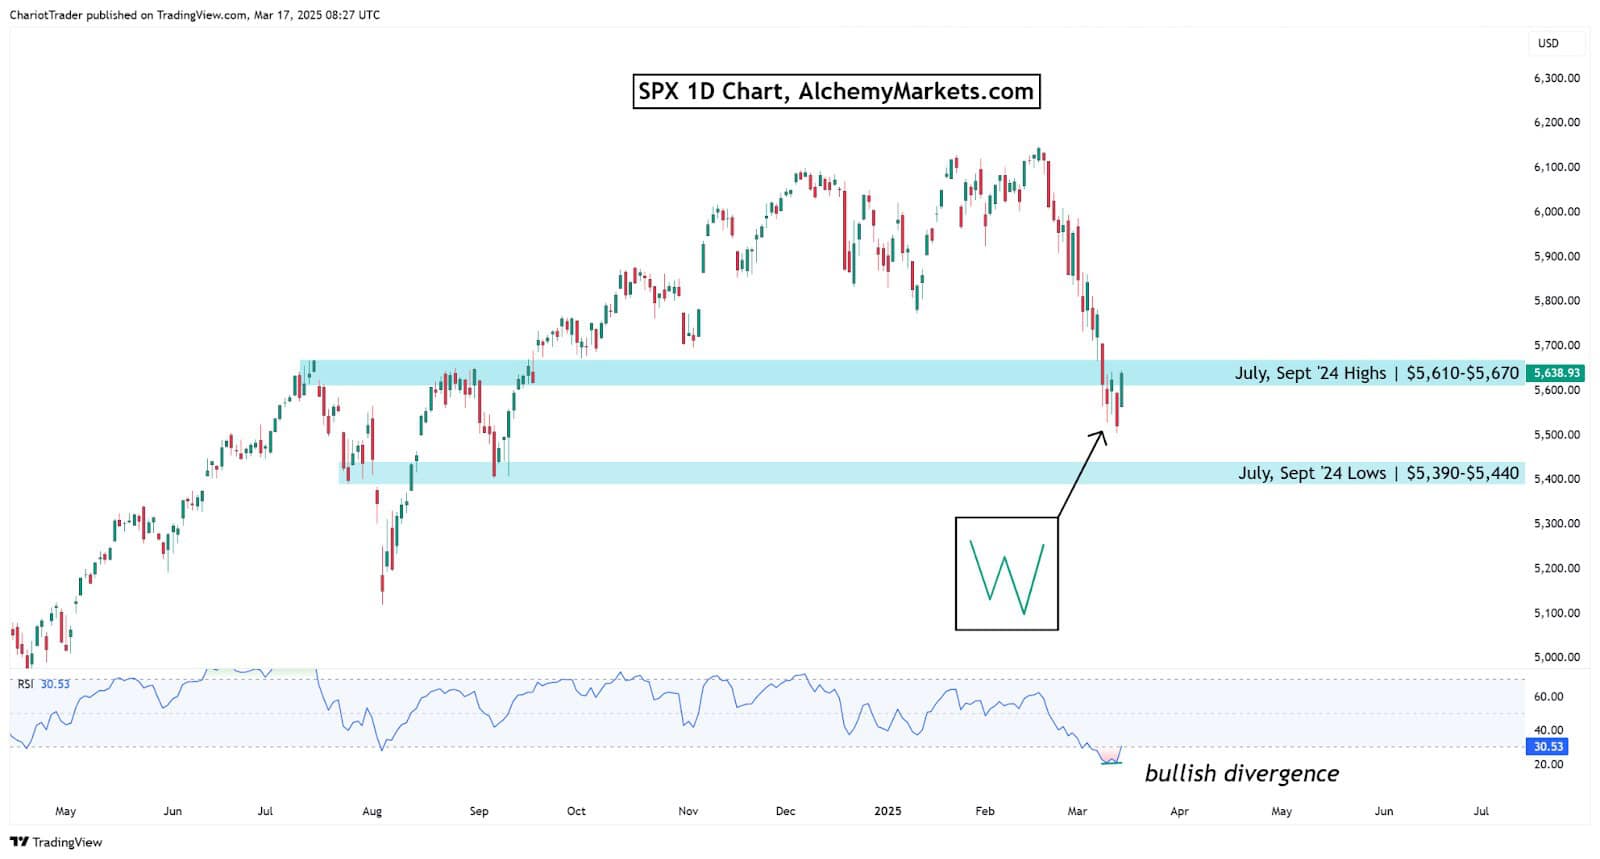
On the SPX 1D chart, notice how:
- There is a small yet visible ‘W’ pattern, just below the key SR levels of $5,610–$5,670.
- This reversal pattern is supported by a bullish divergence.
- A successful reversal here could spike the All-Time Highs formed during July–September 2024, a significant price zone.
| Note: This is not US500’s price. US500 will be similar to SPX in structure, but have slight differences in the prices. |
On the 4H chart, we get a clearer view of the neckline of the Double Bottom, which is placed at $5,642.19.
- A clear break of this level would signal a bullish reversal to $5,782.53.
- This point aligns with the previous low on the 4H timeframe, before the significant decline
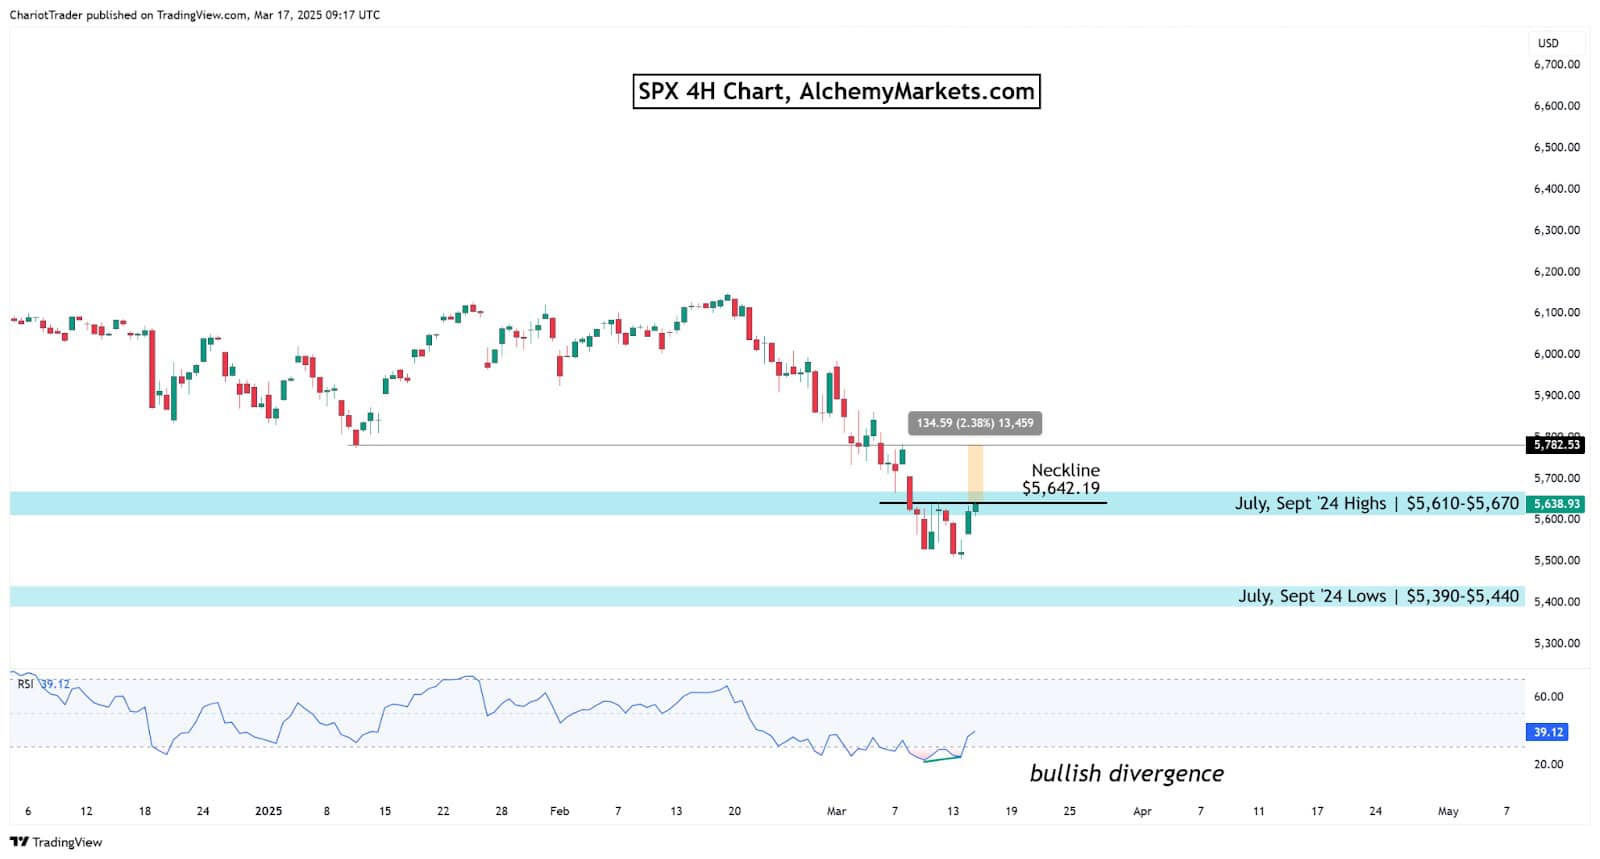
A break of this neckline could simultaneously mean a break of $5,610–$5,670 resistance zone, flipping it into support. In the case of a retest, it would be important for the price to hold the zone, signalling that bulls have enough strength to stay in the market.
You may also be interested in: