Quarterly forecast
- April 1, 2025
- 7min read
2025 Forex Forecast: US Dollar Weak Trend Continues
With Q1 behind us, let’s look ahead and see what the price patterns suggest regarding key forex trends in Q2 2025. We use Elliott Wave Theory as a basis for these forecasts. We’ll analyse the current patterns, see where the current price is within those patterns, and discuss anticipated trends for the Q2 2025.
DXY
As of December 2024, the market was anticipating 50 basis point rate cuts from the Fed in 2025. Now, with the first quarter under our belt and no rate cuts (yet), the anticipation of rate cuts is beginning to grow. speed up. There is now an expectation of 75 basis point rate cuts in 2025 with the first cut anticipated for June 18.
Much of the rate cutting is a result of softening inflation. If this trend continues, then the trend for US dollar weakness likely continues for a large portion of Q2.
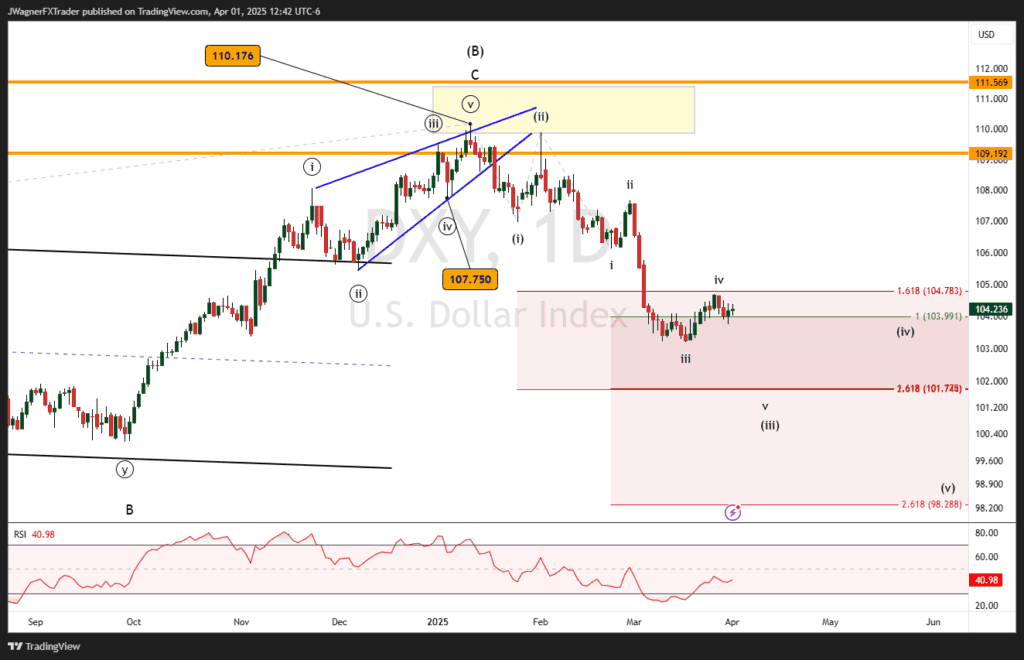
Our Q1 forecast for DXY was spot on. At the time, the dollar was in a strong trend and we anticipated upside targets between 110-111 with a larger bearish reversal at hand.
We know now that DXY topped on January 13, 2025 at 110.18. Since then, DXY has pushed down to 104 at the time of this writing.
This downtrend does not appear over when assessing through the lens of Elliott wave. It appears DXY is in wave iv of (iii). This implies an unfolding bearish impulse that still has a couple of more waves lower to go.
I suspect DXY finalizes wave (iii) near 101.50 in the early parts of Q2. Then, wave (iv) likely proves to be a temporary rally that carries back near 104. Once wave (iv) is in place, then (v) would be a bearish wave to new lows below 100.
It is possible, the wave (v) trend lower could appear towards the end of Q2. The main price action to follow in Q2 is another trend lower to finalize (iii) to near 101.50, then a wave (iv) relief rally to 104.
Bottom line, we are anticipating wave (iii) to trend down to around 101.50, then a temporary rally in wave (iv) to 104. This likely takes up most of Q2. If wave (v) does begin, it would trend lower from around 104 to new lows below 100.
EURUSD
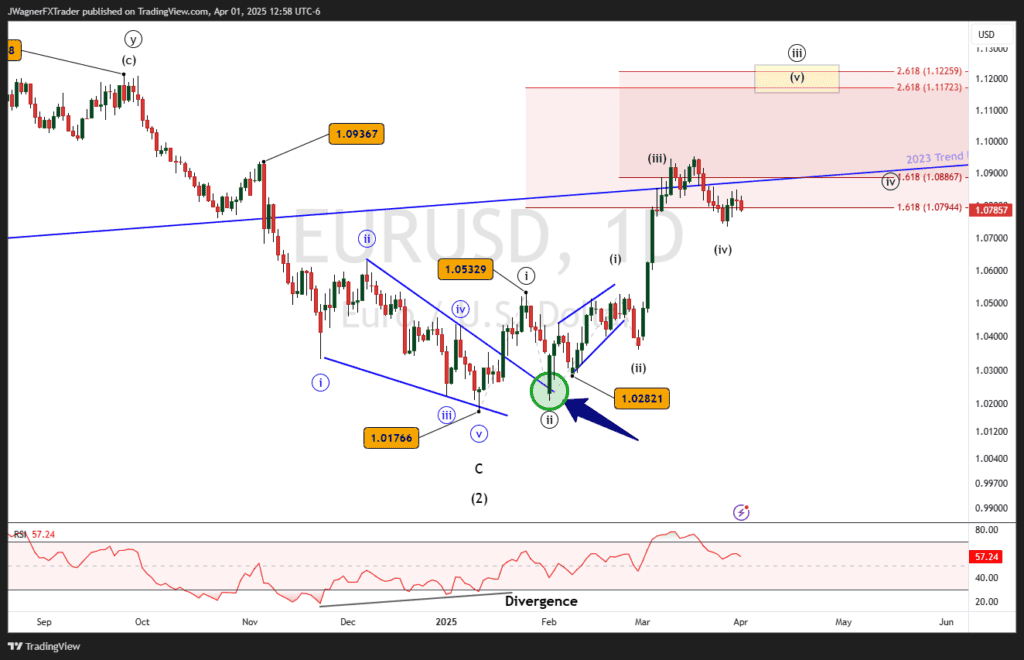
As anticipated in our Q1 report, EURUSD did put in a major low at 1.0177 on January 13, just below our targeted range. EURUSD does appear to be in a cyclical uptrend that likely carries to 1.18 and potentially higher levels in the coming quarters.
The current Elliott wave pattern depicts EURUSD at wave (iv) of ((iii)). Once this wave ends, then wave (v) of ((iii)) rallies to the upside and likely carries to 1.12.
There are several wave relationships popping up near 1.12. Therefore, I suspect EURUSD punches a wave ((iii)) high around 1.12 and begins a wave ((iv)) correction to carry it down to near 1.08.
If all of this happens prior to the end of Q2, then the remainder of Q2 would imply a wave ((v)) beginning to levels above 1.12.
Bottom line, EURUSD appears poised to rally in wave (v) of ((iii)) to 1.12 in the beginning part of Q2. Then, the latter part of Q2 may be spent in a wave ((iv)) decline down to 1.08.
GBPUSD
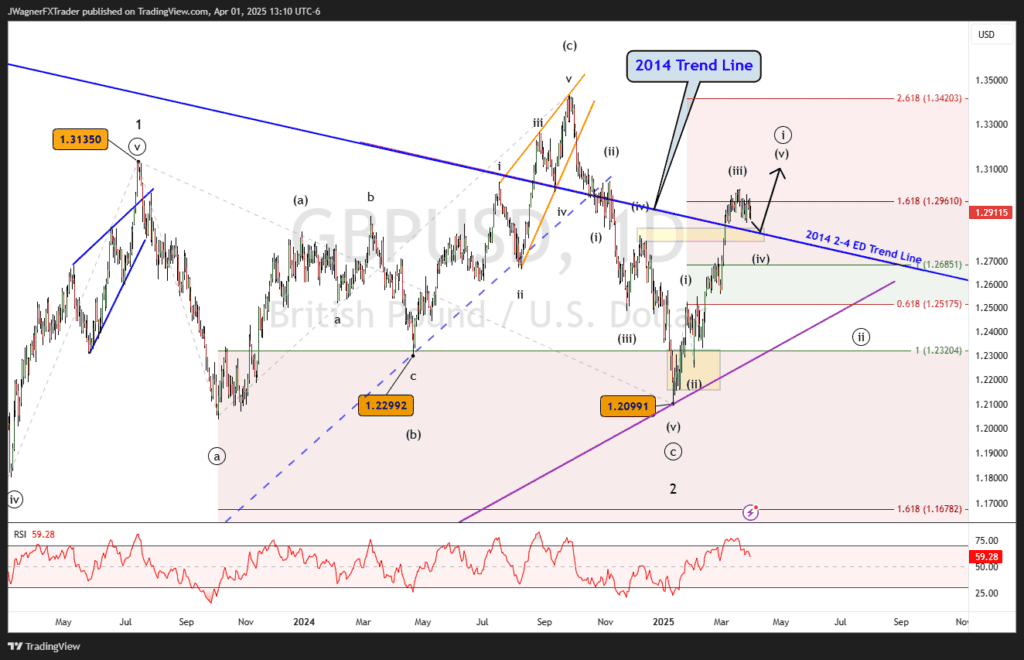
Similar to EURUSD, Cable finalized a large flat pattern that began July 2023 and ended January 2025. Our Q1 forecast was spot on as we anticipated a couple of levels to watch out for on the end of the flat pattern, including 1.2037. The final low printed at 1.2099 on January 13, just above our cited target range.
The current wave appears to be the final stages of (iv) of ((i)). This means a slight dip may begin Q2 and lead to another bullish rally to 1.32-1.33. The dip may find support at an old trend line dating back to 2014.
Once the wave ((i)) high is in place, then the largest decline since Q4 2024 will begin. We likely won’t see that until later in Q2 2025 as GBPUSD breaks new highs above 1.31.
USDJPY
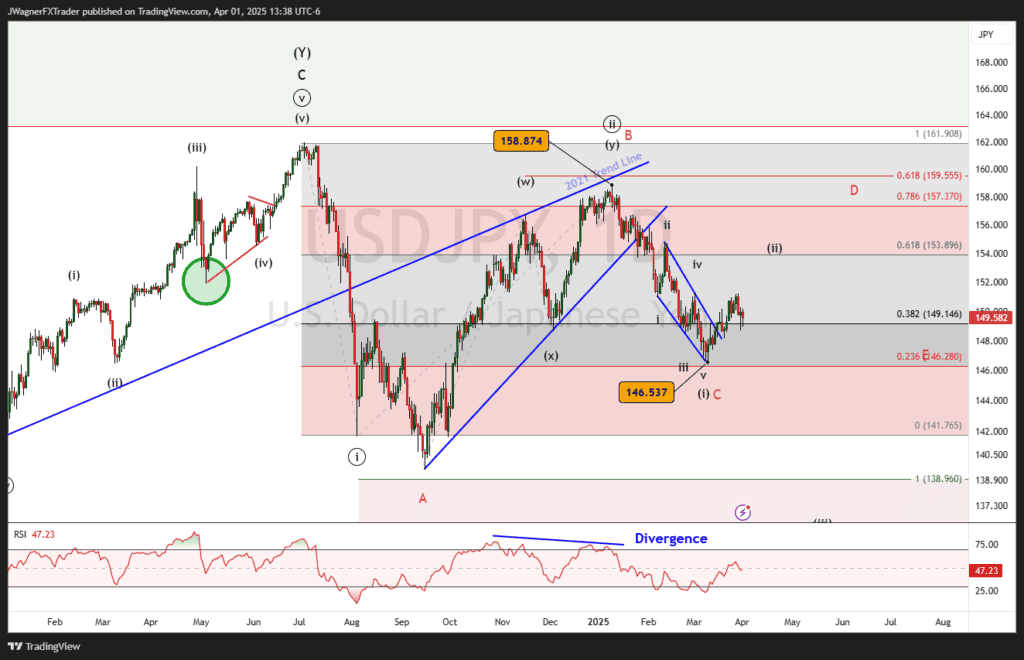
The Q1 2025 forecast remains intact. If you recall, we provided two models we were watching. Both models called for a decline to 146, with one of the models forecasting further declines to below 140. On January 10, 2025, USDJPY did begin a downtrend and reached a low of 146.54 on March 11, right in line with our forecast.
We don’t have enough price action evidence to eliminate either of those two options from Q1. Therefore, we resubmit both options again for Q2. The difference this time, one of the models will separate itself from the other. By the end of Q2, there is a strong possibility we’ll know which Elliott wave count is primarily in development.
The first model that I’m leaning on is that wave three at multiple degrees of trend is about to unfold to the downside. This means a large decline that carries below 140 and possibly reaches 128 in the next couple of quarters.
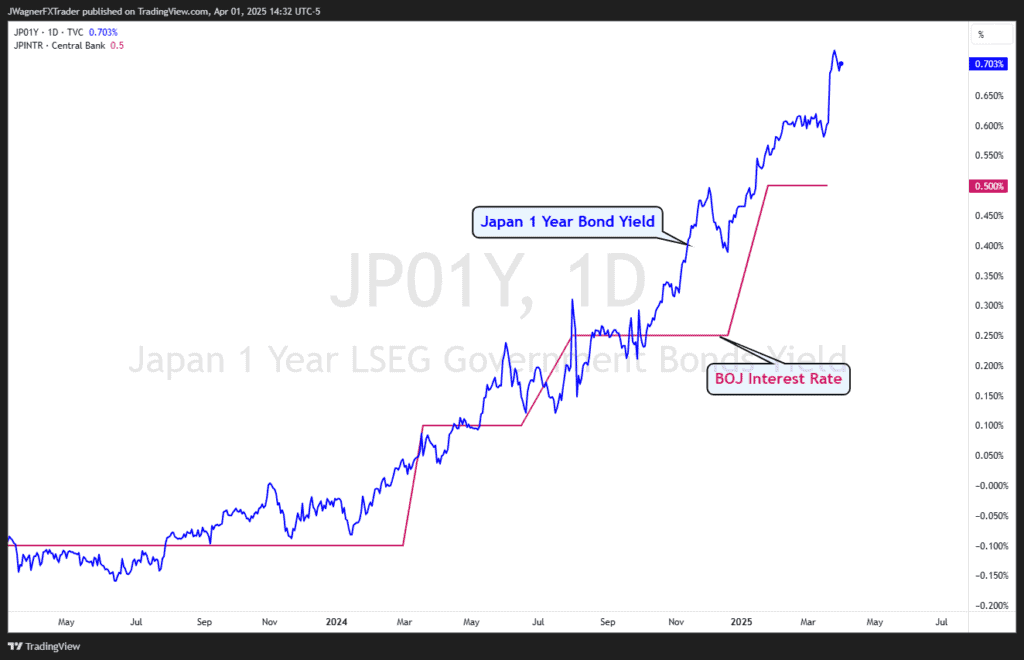
This is a tremendous move and it could be fueled by the Fed cutting interest rates as previously mentioned. Additionally, don’t rule out the Bank of Japan exerting pressure on the currency pair. Japanese interest rates are reaching multi-decade highs. In fact, the Japanese 1-year bond yield has been leading the BOJ interest rate higher.
The 1-year interest rate has reached 0.70% while the BOJ target rate sits at 0.50%. This divergence in monetary policy between the Fed and BOJ could be just the fertilizer to cause a dramatic trend lower in USDJPY.
If a strong decline fails to materialize, then we’ll consider the potential for wave ‘C’ of a large triangle in place at 146. This means the next couple of quarters will include a small rally in wave ‘D’ and decline in wave ‘E’ to finalize the pattern. (red labels in the Elliott wave chart)
AUDUSD
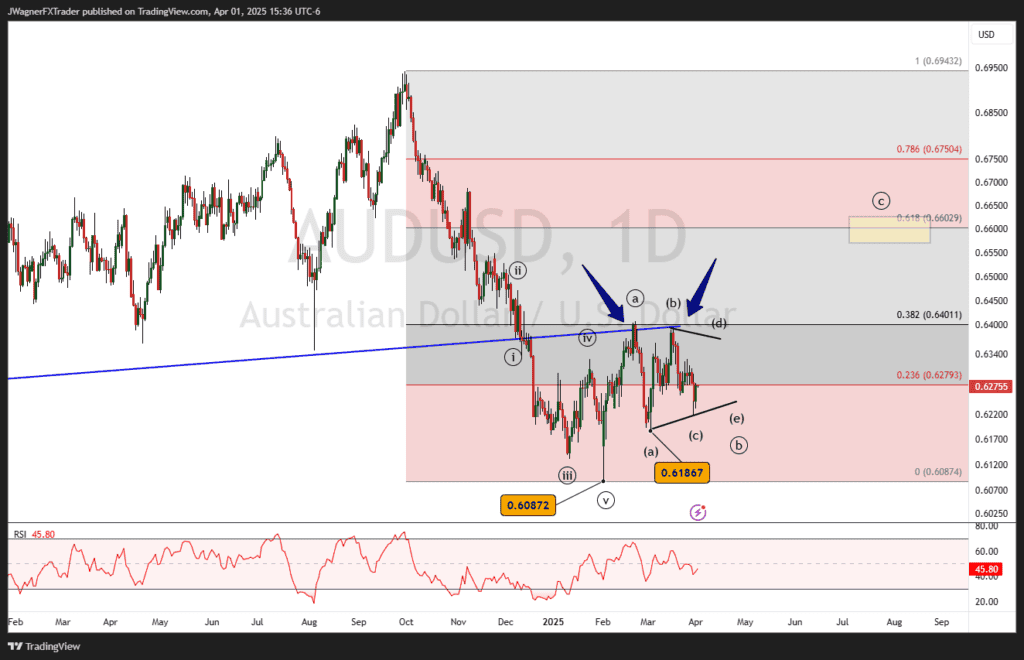
Aussie appears to be singing to a different sheet of music than the other dollar markets. After breaking down below the blue trendline formed from lows that began in 2022, AUDUSD has rallied back to test the underside of the trendline. This broken support trendline is acting like new resistance.
It appears the September 2024 to February 2025 decline is an impulse wave. The subsequent rally from the February 2025 low is shaping as a bullish zigzag pattern. Wave ((b)) of the zigzag is shaping as a symmetrical triangle. Once this triangle terminates, it would lead to wave ((c)) higher that could reach 65 to 66 cents.
In the near-term, if this b-wave triangle holds, then Aussie should hold above the a-leg of the triangle low at .6187.
If .6187 is broken to the downside, then we’ll need to consider other alternatives.
Most of Q2 will likely get chewed up with the carving of this zigzag pattern. If indeed this is the pattern that plays out, then eventually, AUDUSD would retrace back to the February low of 61 cents.
EURGBP
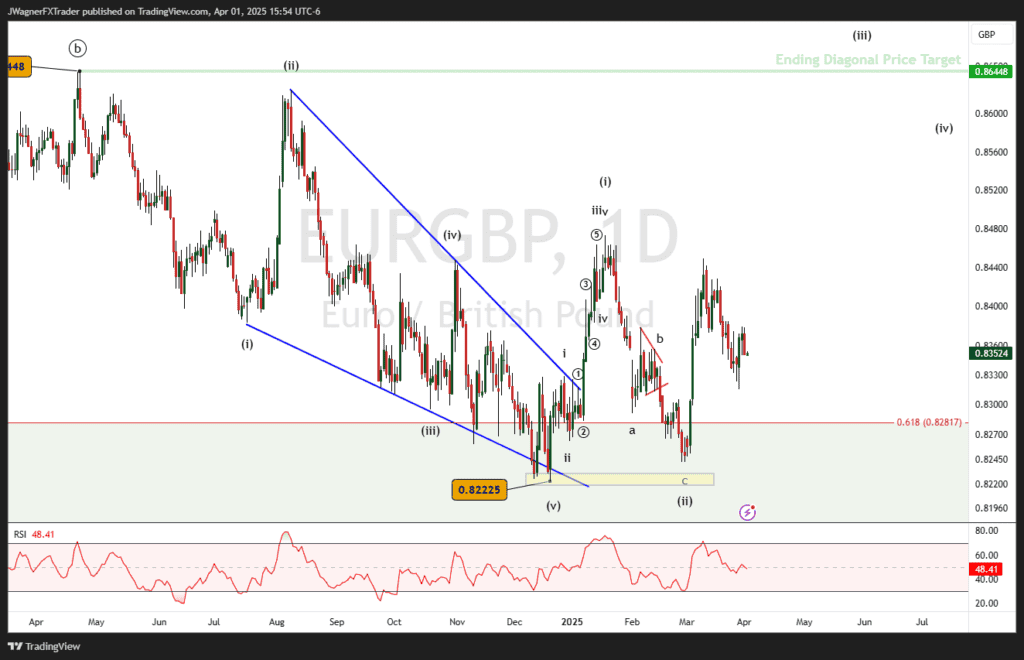
Though many people focus on the USD pairs, I’m still not convinced that 2025 will be purely a US dollar based trend. Looking at EURGBP, an ending diagonal, or falling wedge pattern, appears to be shaping into the December 2024 low.
Ending diagonals are an Elliott wave pattern that signals the end to that wave pattern. In this case, the ending diagonal is the final wave to a larger zigzag pattern. Under such a scenario, there is a strong likelihood that EURGBP rallies from the .8223 low up to the origination of the pattern at .8645.
The pattern has started to make headway towards the .8645 target as it broke above the (ii)-(iv) blue resistance trend line. It has declined back to carve a double bottom with the December 2024 and February 2025 lows.
If so, then the double bottom target may shoot a little higher at 87 to 88 cents.
If this bullish EURGBP pattern plays out as anticipated, then EUR would outperform GBP OR GBP becomes an underperforming currency.
On both the EURUSD and GBPUSD forecasts, I am anticipating a bullish move on both. This EURGBP rate then suggests that perhaps EURUSD takes off first or GBPUSD declines slightly while EURUSD rallies.
Keep this EURGBP market in mind as you trade the larger trends of EURUSD and GBPUSD.
See our other Q2 2025 forecasts: